Online Services

Pay Online
Online Vehicle Registration Renewal Online Property Tax, Water & Sewer payments Online Dog License Renewals Vital Record Request E-Reg Estimates
GIS & Property Database

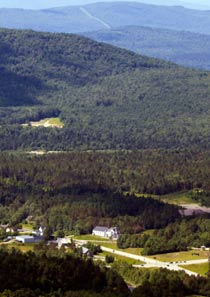
View of Carroll from Sugarloaf

Minutes of Town Board Meetings

Search Minutes of Town Board Meetings

2024 Planning Board Archives

Older Archives

Minutes of 4/17/2024

April 23rd, 2024

Town of Carroll Planning Board
Meeting Minutes
April 17, 2024
5:00 PM
“These minutes of the Town of Carroll Planning Board have been recorded by its Secretary. Though believed to be accurate and correct, they are subject to additions, deletions, and corrections by the Planning Board at its next meeting when the Board votes its final approval of the minutes. They are being made available at this time to conform to the requirements of New Hampshire RSA 91-A:2.”
Planning Board Members Present: Austin Alvarez, Vice Chairperson, running the meeting as Chairperson Alex Foti is not in attendance; Rena Vecchio; Jules Marquis, Selectmen’s Representative; Paula Murphy, Don Jones
Public Present: Michelle Moren-Grey and Taylor Roy of North Country Council; Bonnie Maroney; Joan Karpf; David Scalley; Stephanie Apostle, Planning Board Secretary; Jeff Duncan, Fire Chief; Lois Pesman; John Greer
Minutes Taken By: Judy Ramsdell
Item 1: The meeting was called to order by Austin Alvarez at 5:00 p.m.
Item 2: Pledge of Allegiance
Item 3: Attendance Taken; Quorum Met
Austin Alvarez Introduced the new land use secretary Stephanie Apostle, and thanked Corinne Ripa for her work as the Land Use Secretary.
Item 4: Approval of March 7, 2024 Minutes
Austin Alvarez said he had a correction to the March 7, 2024 meeting minutes. Under Item #9, Page #3, BWPOA Collection/Storage Transfer Facility, the dates for the plans that Austin provided at the last meeting should be corrected as follows: On Sheet 4, it states 10/10/2023 version and it should be November 11, 2023 version and where it says April 11th it should be April 12th. A motion was made by Jules Marquis to accept the minutes as amended. The motion was seconded by Paula Murphy. Motion passes, 4-0. Don Jones abstained as he was not in attendance at the meeting. The March 7, 2024 meeting minutes were approved as amended.
Item 5: Election Results Planning Board
Paula Murphy and Austin Alvarez were elected to the Planning Board. We now have seven board members. Austin said last year at this time we elected Alex Foti as the Chair and Austin Alvarez as the Vice Chair. We need to vote on a new Chair and Vice Chair for 2024.
Rena Vecchio made a motion to elect Alex Foti to be Chairperson for 2024. Don Jones seconded the motion. All in favor, 5-0. Motion passes.
Don Jones made a motion to nominate Austin Alvarez as the Vice Chair for 2024. Rena Vecchio seconded the motion. All in favor, 5-0. Motion passes.

Austin Alvarez made a motion to nominate Tom Godfrey as an Alternate to the Planning Board. Tom did agree at the last meeting to be an alternate. Paula Murphy seconded the motion. All in favor, 5-0. Motion passes. Anyone else interested in being an alternate, let us know. Tom will have to be sworn in so we will let him know.
Item 6: Application: Echo Lake Phase II (Continued from May 4, June 1, July 6, August 3, September 7, October 5, November 2, December 7) tabled January, February and March while awaiting more information for the Planning Board – Due to Date Change, Kevin Leonard is unable to attend this meeting. Looking to push out this item to next meeting on 5/2/2024
Application is tabled to the May 2, 2024 meeting.
Joan Karpf said she is an abutter to this project. Since we voted on a wetlands buffer at the town meeting, and since this application for Phase II hasn’t been approved yet, can you look into how that might affect this development?
Austin said that all of the land use planning board articles, articles 2-7, were approved by the town at the town meeting in March. So those articles will have to be incorporated into our documents. That is something we will have to work on between now and the next meeting. Austin will speak with Alex to address those.
Rena Vecchio suggested, in light of the new zoning ordinance with the wetlands, that we contact Kevin Leonard so it might be ready for the next meeting. Don Jones suggested we should contact Horizons as well. We are getting into warmer weather, and people want to be doing work. Austin said he will take care of this.
Dave Scalley said the Board might want to check with North Country Council to be sure the Board has the authority, where this application has already been set in place, to add that new zoning ordinance to this application. Austin said he will follow-up on that.
Item 7: David Scalley/Meredith Bussiere – Change Old Town Road portion of her property back to a private way
David Scalley is here representing Meredith Bussiere. Dave said after the last meeting when they went for the road name change, he met with the selectboard and got their approval to change the name to Pauls Path. Dave said he spoke with Gardner Kellogg last week, and he is working on finishing the mylar. Dave is asking the board to make a motion to have the chair or vice chair sign the mylar once it is all done. This is from the March 19th selectboard meeting when the road name was approved.
Jeff Duncan said we have talked about this as a private road, and he is asking if this is going to be double ended. Jeff said what is submitted should comply with dead end roads and how are they intersecting Pauls Path. One of them needs to have a turn-around at one point. Dave thinks it is going to be connected. There will be a hammerhead or cul-de-sac. Dave said in the meantime he will review with Jeff, and Dave agreed to be on the agenda for the May 2nd meeting to get the mylar approved and signed.
Item 8: Master Plan Kick Off Meeting with Kaela Tavares and Taylor Roy from North Country Council
--Present and discuss updated data sheets
--Prepare for Phase II of Master Plan Update
--Review & Discuss Draft Scope of Services of Phase II
--Identify Key Stakeholders for Update Process
--Discuss Public Engagement Strategy (Survey, Open House/Event for Outreach)
--Set Date for Kick-Off Meeting
Michelle Moren-Gray Executive Director of North Country Council said they all should have received an email that Kaela Tavares has moved from the area. NCC has hired Angela Cleveland, who has over 25 years of experience with community planning and economic development. Taylor Roy, associate planner will also be working on the Master Plan Update.
Michelle said the hope was to kick this off in March but got behind schedule. Would like to review the data and review what is coming in Phase II and talk about that contract. We will kick it off half-way tonight and once we sign the contract for Phase II we will kick it off officially.
John Greer said that he and Bonnie Maroney are in attendance as members of the public and not in an official Selectboard capacity.
Taylor Roy associate planner will present Phase I data. Copies were distributed to all in attendance.
Taylor reviewed “The People” Data Update Summary Document
The summary sheet contains updated data for discussion and for use of the Planning Board in updating the 2015 Carroll Master Plan. This summary sheet follows the order of data as it appears in the 2015 Plan, as well as additional data points to consider at the end. For each data point the raw numbers are provided along with table and charts to illustrate the data. Taylor wants to be sure that the graphs are readable and understandable.
Town Population is self-explanatory. Most of this source for these three graphs is from the 5- year estimate—2022 ACS 5-year Estimates S0101. Jeff Duncan asked what consists of population? You can add 400 people to that number. Taylor said these numbers are based on census data. Small towns randomize data when it has to do with disability. Can’t pinpoint exact residences because it is a small town. Number of voters is approximately 800. This data is taken from the 2020 census. Carroll has a lot of transient people in town and out at Bretton Woods as well. At certain times of the year that increases the numbers. A lot of second home people are out at Bretton Woods. Very few who are here full-time. Is there some way to take that into account? Taylor said on page 4, they have data on seasonal units in town indicating they are not here all year long. She put trend lines in as well. Taylor can look at a comparison of population to seasonal units. Joan Karpf thinks it is more beneficial to see a trend and not just one specific data point. Then you can anticipate where we are going and what we are going to need. Not a picture of just one particular time, but rather how it is trending so you can prepare for that. Michelle said they can incorporate population projections both by age and projections according to ODP. The basis where NCC started with was what was in current master plan. They can include projected population data, but for the influx of population that is not here all the time they could potentially look at different sources for that. Not sure what the source would be. That is important to note. Since the last time the master plan was created, the growth and influx that came here year-round is pretty significant. This is all based on the current data you had, which is great data, and they have refreshed that, but they can certainly add to it as well. Joan said her understanding of a master plan is to anticipate what is coming so you can financially prepare for what you need. Where are we going to be in ten years? Paula Murphy said Covid brought more people here full-time in 2020.
Taylor said she can also include additional years of data if that is helpful. They do population projections with a disclaimer they don’t know how accurate it is.
Households in Carroll have gone up, increased by 5.5% from 2000 to 2010. While the number of households increased by 35.3% from 2010 to 2020, a much larger percentage increase. This information is pulled from census data. Type of dwelling units is broken out as well. Jeff Duncan said he questions how they came up with 87 units that include 5 or more units. That does not seem to be accurate. Could some of the data be pulled from actual town data? Michelle said possibly from building permits as long as they have been consistent through the years. Tracking system in other towns have not been consistent. How do we analyze and look at it? Sometimes it is hard to separate the data. Bonnie Maroney said she knows Land Use has to report their data to the state. Michelle said they will have to see what system the town utilizes. Michelle said that they can look at voter registration data. There are things they can look at, buy they started with the basic data they had in their original master plan.
Taylor said she did some comparisons to Littleton NH because it is in our labor market area. The labor market area data was pulled from NH Granite Stats. They separate census data based on labor market areas.
Housing Data
From 2000 to 2010 there was a 12% increase in total housing units. From 2010 to 2020 there was a much smaller increase at 1.6%. Taylor said she can add in the data from 2020 to 2022. NH Housing might have some housing projections—but how accurate is that data? They can look at that. Bonnie said another item would be to find out how many Air BnB’s there are in this town, which does impact our facilities and services and needs to be recognized moving forward with the master plan. We are tracking Air BnB’s moving forward at the town level. Michelle said they can try to do the best they can to obtain that data. Jeff Duncan said WMUR recently had an article about the Air BnB data. Maybe we could look at what the concentration is focusing around the Mt. Washington Hotel.
Joan Karpf said there has been a lot of activity and conversation about building a second residence smaller than your initial residence for family members. She thought the House was trying to pass a bill to allow more units on your property. Do you anticipate that happening? Michelle said that is data different than the data they are looking at today. A lot of conversations are going on about ADU.
Taylor said that she did another comparison to Littleton LMA (Labor Market Area) region again, and Carroll’s seasonal housing made up 19.3% of the total housing stock in 2020. Seasonal housing stock has been increasing. From 2000 to 2010 Carroll’s increase in seasonal units made up 15% of the overall increase in seasonal units in the labor market area. The decade from 2010 until 2020 saw a smaller increase at only 5%. Taylor said the source for this information is again the census date. Taylor said something new they included in the data this time is the year homeowner moved into the unit in Carroll. It shows the year people moved here, which is very interesting. It was pointed out that there appears to be an error in this graph—the lines don’t match up with the years.
Type of Dwelling Units in Carroll: It was pointed out that there seems to be incorrect data. 87 units with five or more units is not correct. This is according to census data, and they will revisit this. The number of mobile homes and what the definition of mobile homes was was discussed. There are not 36 mobile homes in Carroll. It is from census data, and they can pull the definitions. This could be invalid data for the community. Bonnie pointed out that in the past few years anyone who leaves their campers here year-round receives a tax bill.

Year Housing Structure was Built in Carroll: 1980 to 1989 was the largest. Dave said this is where they need to go over the permits. Between 2010 and 2019 there were more than 12 units built in Carroll. How building permits are classified was discussed. There is an annual list broken out listing what the permits were for.
House Heating Fuel Sources in Carroll: Taylor will get the definitions to go along with the Types of Fuel. Dave said this is a template. Dave can forward them Sara Brewer’s email, who has all the information on the town’s building permits for the past five years. We had to do that for the ISO report.
Buildings Permits in Carroll: Will look at town records to fix these numbers.
Table for Vacancies in Carroll: Taylor will add more years. This is separated by how census had it broken out. Wonder what seasonal, recreation, occasional use means—is it vacant for part of the year, only lived in part of the year. They do realize that now some of those seasonal and part-time residences have gone to permanent residences. The tough part is if we are able to get more accurate data. They will also look up to see if this data includes hotel and cabin rentals. Typically, hotel rooms aren’t falling into that category. Tonight, they are looking for what we don’t like and what we would like to be included in our data. They will correct the data going forward. They are starting with the data that is included in the current master plan. They can add to it anytime if we can get the data. Data can be hard to get in our communities. The census doesn’t always open that up. These unique situations, like Air BnBs and the increased amount of people living here than before just doesn’t always come out.
Don Jones suggested looking at the story of all these different charts, and look at it from the top down. Does the data support those dozen or so hypotheses? There is a story we want to tell, and we can look at all these charts and we can always debate data, but we know from being here day in and day out can we validate these thoughts we are seeing?
Austin said this is a lot of information that we haven’t had a lot of time to absorb this. Austin said he would like to go back to the first sheet and determine the schedule.
Income: Includes Median Household Income; Average Per Capital Income, a comparison of Median Household Income and Per Capita Income with area communities. Austin suggested we include a median point data, like 2016 to 2023, as it is a big jump from 2011 to 2022.
Housing Affordability: Broken out by households spending 30% of Income on Owned or Rented Dwellings in Carroll. Jeff said he would throw out those pages, representative of only 35% of the Town of Carroll. There are a lot more homes than that in the town. How are the rest of the homes represented?
How do we provide accurate numbers to this? Joan Karpf said that is the problem with a tourist town. Michelle said that is the challenge with census data, and this is what we have to work with. There are flaws in US Census Data, but it is the best data that we have to work with. No other data source to get this data from. Dave said unless you drive around town and go house to house. Michelle replied that you can drive around and count houses, but we are not going to knock on doors and ask people how much money they are making. Jeff said that this is not going to benefit the town to plan the future of the town based on inaccurate data.
Michelle said they can look at the town data, and how they want to project that into the future. Census data is challenging with seasonal residences and high influx of visitors. Margin of area can be higher with smaller populations. All of the data leads to hypothetical questions to formulate a vision around. Again, this is the data included in the current master plan. We have to start somewhere. Jules asked under per capita income, could you include cost of living in with those median household income levels? We could determine if the cost of living is becoming more or less affordable. John Greer asked if we can we put a disclaimer in there that says the census data is not accurate and add more accurate data? Michelle said she doesn’t think we need to put in a disclaimer. We will have the census data with definitions and charts to back it up. We can say we went to local information due to the inaccuracy of the census data. John said he feels we should use accurate information. He has a problem putting in information that is not accurate. Numbers we use are what we use to plan for the future. The graphs and tables are great, but we need accurate data. Dave said that is where the town will have to step up and get accurate numbers. Rena agrees with what Dave said. They are going on what they have for information. It is not a waste of time—it is according to the census. It shows us what the typical census was during a time frame. Town can step it up a bit and present that to them so they can integrate it separately. No way you can project from the census with what we know. Michelle said to be sure you keep the tracking system consistent. If the town has a good tracking system, the data can be used.
Joan said it would behoove NCC to find a way to use this real information. Benefits the people in the state who don’t understand how different a tourist town is. Trying to get Rooms and Meals tax back to this town. They don’t seem to understand that concept. We only get it based on population. Joan said the town spends a lot of money to support the visitors who come here.
Dave said the graphs are great – need to put in correct data. Michelle said we can use the US census data and they can take town data as long as we can get apples to apples for a 10-year span. Create charts along side that. This is the town record data. The Planning Board will need to help with that list. Might see a similar trend but more realistic numbers. May come out with the exact same result. As soon as you put the data in, it will be out of date. Track consistently and measured in the same way relatively easily.
Taylor reviewed the charts for Gross Rent as a Percentage of Household Income in Carroll; Renter & Owner Occupied Units, and Owned Homes in Carroll with and Without a Mortgage. Taylor said she can add a year in the middle, i.e. 2015.

Employment: Source: Granite Stats employment data 2022. When looking at employment data, what is important for you to display in employment data? This is what is in the current plan, and is that of value to you? It was suggested to look at just what is our growth sector and have a pie chart to compare to. This warrants some further discussion. Not sure if this is helpful. Looking at growth in the sectors may be more helpful. Can see what sector is growing in that respect. What is the average wage in that sector? Does the group find this valuable? Don does not feel this gets us where we want to go. Why don’t we pull this out and look at industry growth as a starting point.
Also look at wage rates compared to that and see if there is anything that would make sense. Look at th number of employers and see if that has changed. We possibly could use Community snap shots put out by Employment Security and look at trends in that. More valuable than these numbers. It may be better to do it by town. Labor market area might be a better comparison to use. Coos County is a good reflection of the labor market area. Grafton County data is skewed with the Hanover/Lebanon market.
The Highest Employing Business chart--are we looking at it as full or part time employment? Full-time employees. Taylor said the source was Granite Stats. Community profile probably has more accurate information on the highest employing businesses.
There is also a chart that shows people who commute into Carroll, people that work and live in Carroll, people that commute out of Carroll and people employed in Carroll. How about including the number of retired people? Census has that information. Taylor can look that information up.
Average commute time to work: Commuting times in all regions have lengthened by about 30 seconds to a minute but have otherwise stayed relatively the same from previous years.
The Land Data Update Summary Document
Taylor said our current master plan did it all in text, and Taylor designed this section to be more visible with pictures with information, i.e. Coldest Month, Warmest Month, Highest & Lowest Record Temps, Number of days of sunshine, of precipitation; Average rainfall per year, and Average snowfall per year. The Board likes this.
Conservation Land: Private land in current use is under forest, farm, and unproductive land. Taylor will add acres next to the numbers, and will also double check the numbers as they currently don’t add up.
Natural Areas & Wildlife – best data she could find was from the U.S. National Forests FY16-Fy20 National Visitor Use Monitoring Summary Report. Difficult to find reports on visitors and number of visits. Will add text to describe the percentages. More than half the people who visit the national forests visit more than one to five times a year.
Joan Karpf said there was a recent presentation on wildfires. Was anything discussed about that looking out 10 years and how it would affect our land use regulations, i.e. what could be incorporated into our ordinance to protect homes? Michelle said we are trying to stick to the data we are discussing this evening. This would more impact your Hazard Mitigation Plan
Do you want to keep Household Income of National Forest Visitors? Helpful to see what the income is of people visiting the National Forests in Carroll. Section from the Forest Service, lists 1200 hiking trails; 400 snowmobile trails; 160 Appalachian Trails; 23 Campgrounds; 6 ski areas; and 4 alpine ski areas. Ausin said there are also cross-country ski trails.
Threatened & Endangered species in Found in Carroll: Do you really want this in the master plan? If not, we can remove it. Don Jones suggests leaving it out. In narrative when you talk about land use you can talk about some of those species in that habitat.
Section on Flooding events might be helpful. Bonnie said a lot of that information is in the Hazard Mitigation Plan. One way it could be displayed is to display the number of federally declared disasters over a period of time and potential impact of that. Refer to those emergency plans. Major routes in and out of town of Carroll are major routes and can be impacted by these high storm events.
Joan Karpf asked if NCC did something in regards to culverts recently? NCC has done some projects on stream crossings with NH Fish and Game and NH DOT. Michelle said this is a topic for another day.
Town Facilities and Education: Taylor pulled this data from the NH Department of Education data for the SAU 36 Fall School Enrollment. The last master plan projected school enrollment would go down a bit, which it did.
Transportation: – Annual Average Daily Traffic Table data is collected from the traffic count NCC does in conjunction with NH DOT. It was included on the old plan, and Taylor added 2015 thru 2022 data. These are collected on a three-year cycle and are listed on the DOT web site. Taylor thought it was helpful to add in the miles of highways in Carroll: Class I: 19.13; Class II or secondary highway: 9.3; Class V highways: 12:11, and Class VI highways: 0.77.
Taylor included Time of Arrival to Work for Carroll Residents. She thought this information is good and interesting. Shows patterns of traffic and how busy your intersections are at what time. Jeff Duncan suggested that it would be helpful to include the town miles (road miles).
They pulled maps from what was done last time and updated them. These are all going to carry into the next phase. Take time to look at these, and they can drop off some larger maps better printed so they can look at them. We will have an opportunity in the next phase to discuss these maps and data and determine what we can keep and what is not needed.
In regards to the timeline, we are technically in Phase I planned to be from January to March 2024. We start with data. The data is the piece that communities have a time getting. Based on what we have heard tonight, we know we are going to have revisions in that section. No way is the data set. Can we reasonably do it within what was scoped out?
Phase II, NCC would do some data updates and then would start with that kick-off meeting and revisit data and talk about who are the stakeholders who should be at the table? Need to be sure we are getting feedback from fire chief, police chief, etc. Talk about what is the community outreach piece going to look like, i.e. a survey, set up an open house. Want to solicit information from residents. A Farmer’s Market may not be the best location to do the survey. Setting up at the transfer station is a possibility. What is the best time to launch those community events? Summer is usually a good time.
Surveys would be for residents, but we could look at it differently. Make that distinction--are you a resident, full-time resident, homeowner? That would be on the survey. There could be paper copies and QR codes as well for the surveys.
Austin said that BW has 417 units. There may be 5% who are full-timers. Probably 45% air BnB renters.
We can craft it by looking at the survey you used last time and craft it so you can answer those questions. Bonnie said the entire cost of this project has been included in the budget.
It was suggested that it may be best to hold these Master Plan Committee meetings separate from the Planning Board meetings. There is not a Master Plan Committee set up yet. Austin said we need more people involved than just the planning board. Austin said we need to talk among ourselves and come up with a schedule we can support and for anyone in town who would like to participate. Michelle had a contract she left for Phase II.
Don Jones said he has to leave at 7:00 p.m. so we will not have a quorum for the rest of the agenda. It was decided to complete the rest of the agenda at our next meeting on May 2nd:

Item 9: BWPOA Collections/Storage/Transfer Facility – Update to provide the Planning Board with the latest Site Plan for the Facility
Item 10: Review Rules of Procedure
Item 11: All Other Business
Item 12: Adjourn Meeting
Rena Vecchio made a motion to adjourn the meeting at 7:07 p.m. Motion seconded by Jules Marquis. The meeting adjourned at 7:07 p.m.